
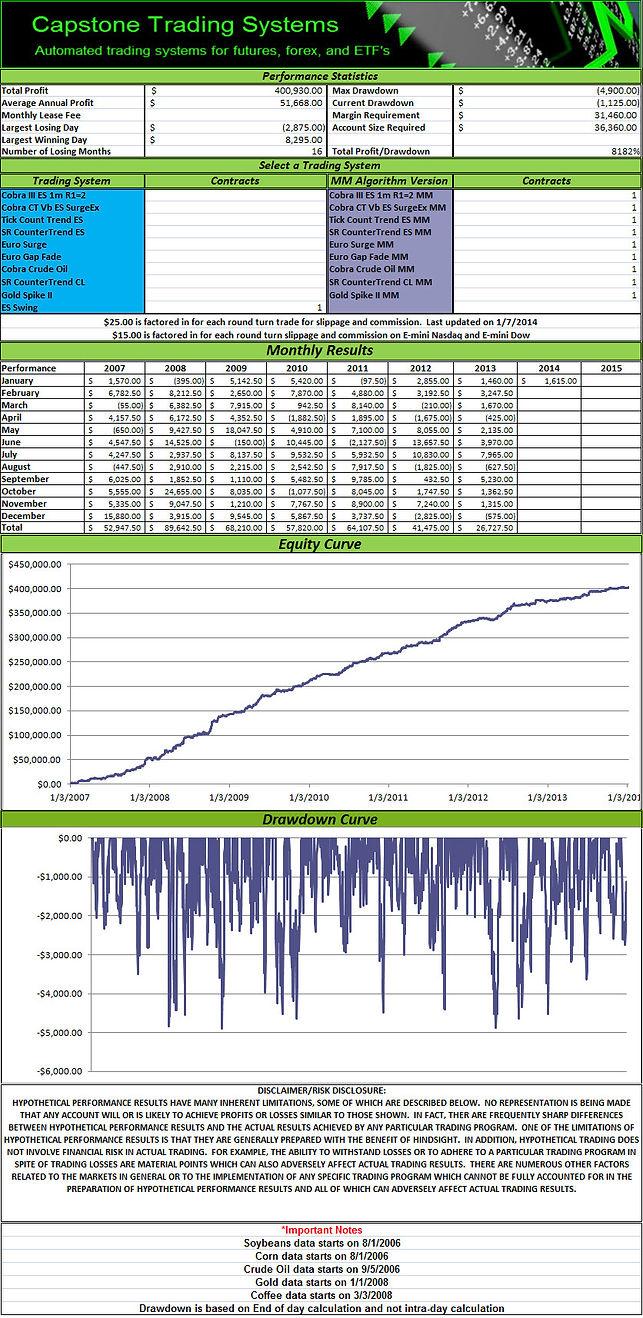
Nine System Portfolio

The Nine Trading System Portfolio is a multi-system portfolio that can provide diversity. It works in the Tradestation, NinjaTrader, and MultiCharts Platforms. The goal of a portfolio is to have a diverse set of trading systems so that while one set of systems, based on one set of market conditions, is going through a drawdown then another set of systems based on different market conditions will make up for the losses of the systems that are going through the drawdown. A common set of different market conditions includes trending versus counter trend market conditions.
In November 2012 we released the Nine System Portfolio. All nine trading systems are day-trade. The portfolio includes 4 e-mini S&P trading systems (2 trend, 2 countertrend), 2 Crude Oil trading systems (1 trend, 1 countertrend), 2 Euro Currency trading systems (1 trend, 1 countertrend), and a counter trend Gold trading systems Gold Spike II trading system.
Portfolio Update on October 1, 2013
On October 1, 2013, we remove Soybeans Daytrader II from the Nine System Portfolio and add Gold Spike II trading system. Soybeans Daytrader II is a strategy that has good performance but has not traded since April 1, 2013 and our portfolio has become more of an eight system portfolio. The Soybeans market has changed and we are adding Gold Spike II to add the Gold market to the Nine System Portfolio. At the bottom of this page, we show the results for the original portfolio with Soybeans DT II.through September 30, 2013 while the updates going forward from October 1, 2013 will include Gold Spike II instead of Soybeans DT II.
The list of trading systems in this portfolio as of October 1, 2013 are:
1.) Cobra III E-mini S&P
2.) Cobra CT Vb E-mini S&P
3.) Tick Count Trend E-mini S&P
4.) SR CounterTrend E-mini S&P
5.) Euro Surge
6.) Euro Gap Fade
7.) Cobra Crude Oil
8.) SR CounterTrend Crude Oil
9.) Gold Spike II
Download Tradestation Performance Summaries
updated on 01/07/2014
Nine System Portfolio
We do not trade the portfolio on holidays or early closing days
and the results from those days have been removed.
(click to zoom in)

All nine strategies work in Tradestation, NinjaTrader, and MultiCharts.
Improved Nine System Portfolio
Results using our Money Management Algorithms (purchased separately)
& Stock Index Swing Trade System
(click to zoom in)
Monthly Subscription $400/month
*For Tradestation, NinjaTrader, MultiCharts
*2 contracts per lease, additional leases for additional contracts
Special Offer $2,995 through Sunday 1/12/2014 (normally $3,600)
Includes 4 contracts and our Stock Index Swing Trade System
*For Tradestation, NinjaTrader, and MultiCharts
*Normally 2 contracts per lease
Original Nine System Portfolio
with Soybeans DT (instead of Gold Spike II) through September 30, 2013
(click to zoom in)

Related Links
Ugly Equity Curves and the Million Dollar Portfolio
TRADING SYSTEM DESCRIPTIONS
Cobra III E-mini S&P
Cobra III E-mini S&P is based on a pattern developed in 2005 as a trend following trading system for the stock indexes. It uses market internals such as the Advance-Decline line. The strategy tests well back to 11/1/1997 (beginning of day session for the E-mini S&P) with R1 being a selectivity input based on ranges of 5 minute bars. R1=2 is what we use in the portfolio. R1=1 is more aggressive and has done well lately too.
System Inputs

Tick Count Trend E-mini S&P
Tick Count Trend E-mini S&P is based on an indicator developed in 2010. The strategy is a trend following strategy for the stock indexes and used the NYSE TICK to determine the trend. The strategy tests well back to 11/1/1997 (beginning of day session for the E-mini S&P). The strategy buys tight pullbacks in bull markets and shorts small rallies in bear markets. This is difficult technique to employ manually that the trading system specializes in.
System Inputs

SR CounterTrend E-mini S&P
SR CounterTrend is a strategy that we have used for the last three years and added to the list of available trading systems in September 2012. This strategy trades support and resistance levels in the stock indexes and uses the NYSE Advance-Decline line to help determine the trend and overbought and oversold conditions.
The strategy tests well back to 11/1/1997 (beginning of day session for the E-mini S&P) with R1 being a selectivity input based on ranges of 5 minute bars. R1=2 is what we use in the portfolio. R1=1 is more aggressive and has done well lately too.
System Inputs

Euro Surge
The Euro Surge trading system is automated strategy available that trades the Euro Currency from 2 am – 1 pm EST, during the European trading hours. It is designed to take advantage of trends that occur at night and the first part of the U.S. trading session.
Many times, the trends in markets like the Euro Currency may take place at night with the trend, range, and volatility ending once the US Stock market starts. This strategy uses a $300 stop loss and will take a maximum of one trade per day. This strategy tests well back to the beginning of the Euro Currency futures data.
System Inputs

Euro Gap Fill
The Euro Gap Fill trading system is an automated trading system that trades the Euro Currency from 2 am – 1 pm EST, during the European trading hours. It is designed to take advantage of counter trend Gap Fills at the 2 am EST open in the direction of the daily trend.
We have found trading system opportunities during the time from from 2 am – 1 pm EST, from the DAX open, towards the European stock market close as volume and ranges are higher during this time period. This strategy uses a $500 stop loss, $200 profit target for some gap patterns and no profit target for other gap patterns. It takes only 1 trade per day maximum (if the strategy trades, it does not trade every day). The strategy does not take trades after the first 10 minutes of the session.
System Inputs

Cobra Crude Oil
Cobra Crude Oil trading system is an automated day trading system that trades the trend on a one minute chart from 9:30 am – 2:30 pm EST taking long and short signals on the Crude Oil (CL) futures. It uses a $700 stop loss.
It is a “middle trend” finder and the goal is to take a piece of the trend, instead of buying breakouts or trying to pick tops and bottoms. It exits all open long trades at 2:30 pm EST and short trades by 12 noon EST, if it is still in a trade and takes a maximum of one trade per day.
System Inputs

SR CounterTrend Crude Oil
SR CounterTrend Crude Oil is a counter trend support and resistance trading system that uses traditional support and resistance methods combined with additional proprietary methods for determining the trend. We have developed this strategy from the SR CounterTrend E-mini S&P, which uses market internals to determine the trend. Since market internals only apply to stock index futures, we have additional methods to determine the trend of the Crude Oil market.
For Crude Oil, our support and resistance numbers vary depending on the short term trend.
System Inputs

Gold Spike II
The original strategy, Gold Spike trading system, was designed and released on 5/26/2011. The second version, Gold Spike II trading system, made two changes to the original strategy and is released on 7/18/2013. The two changes include:
1.) Require the ADX to be greater than 10 to prevent trading in a trendless market or a market that has a low probability of moving enough to take a day trade.
2.) Change the limit order entry from an indicator based value to the lowest low of the last 12 bars for longs or the highest high of the last 12 bars for shorts.
Gold Spike Trading System Inputs

Trading System Videos
E-mini S&P CounterTrend and Portfolio Selection
Trading System Seasonal Portfolio Analysis
Trading Crude Oil in NinjaTrader
Swing Trade the E-mini S&P
How to Trade Coffee Futures
Seven Trading Systems for the S&P Futures
Trading Gold at Night


Videos & Market Updates


Trading Partners

